
Design notation and specification are essential components of the software development process in software engineering. They entail expressing and recording a software system’s architecture, behavior, and design choices. These specs and notations aid in stakeholder communication and direct developers in correctly developing the product.
Design Notation:
Data Flow Diagram (DFD):
A data flow diagram shows how data moves through an information system graphically. It can show the flow of data that is saved, sent out, and received. The data flow within the system is not included in the DFD at all.
DFD and flowcharts differ significantly from one another. The flowchart shows how control moves across program components. DFDs show how data flows through a system at different levels. There are no branch or control elements in DFD.
DFD Types:
Data Flow Diagrams can be Physical or Logical-
- Logical DFD: This kind of DFD focuses on the data flow within the system and its processes.For instance, the transfer of data between several entities in a banking software system.
- Physical DFD: This kind of DFD illustrates how the data flow is put into practice within the system. It is closer to the implementation and more detailed.
DFD Components:
Data source, destination, storage, and flow can all be represented using DFD with the following set of components:
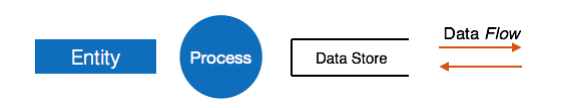

- Entities: Sources and destinations of information data are entities. Rectangles bearing the corresponding names are used to symbolize the various entities.
- Process: Rectangles with round edges or circles depict the actions and actions taken on the data.
- Data Storage: There are two ways to depict data storage: either as an open-sided rectangle with only one side missing or as a rectangle without any smaller sides.
- Data Flow: Pointed arrows indicate the movement of data. Data movement is displayed moving toward the head of the arrow as the destination from the base of the arrow as the source.
DFD Levels:
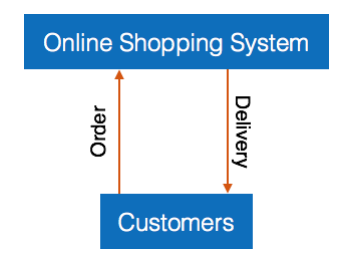
- Level 0: This DFD is the highest abstraction level and shows the information system as a single diagram with all the underlying details hidden. Context level DFDs are another name for Level 0 DFDs.
- Level 1: The more detailed Level 1 DFD is derived from the more general Level 0 DFD. Level 1 DFD shows the system’s fundamental modules as well as the data flow between them. Basic information sources and procedures are also covered in Level 1 DFD.
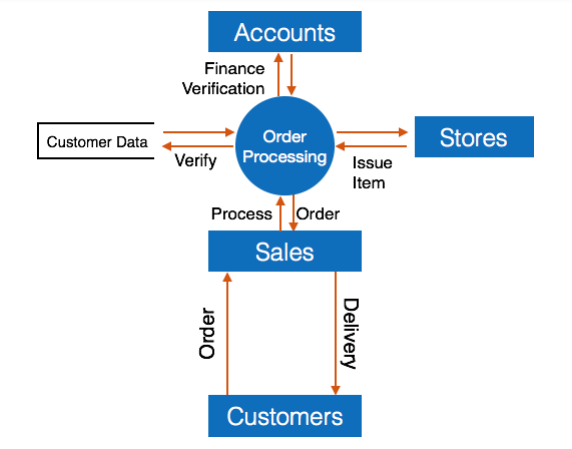
- Level 2: DFD illustrates the data flow within the modules that were discussed in Level 1 at this level.
If the required degree of specification is not reached, higher-level DFDs can be converted into lower-level DFDs that are more detailed and have deeper knowledge.


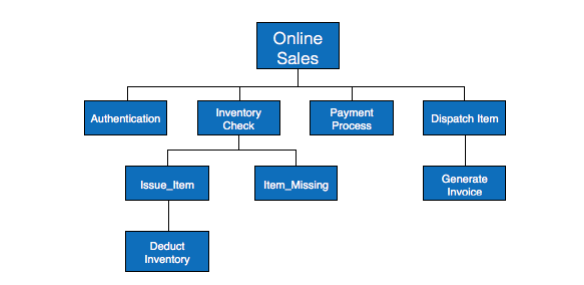
Structural Chart:
A chart that comes from a data flow diagram is called a structure chart. Comparing it to DFD, it shows the system in greater detail. Compared to DFD, it provides a more detailed description of the functions and sub-functions of each system module and breaks down the entire system into its lowest functional modules.
The modules’ hierarchical structure is represented by the structure chart. Every layer has a specific task that is carried out.
The following symbols are utilized when creating structural charts:
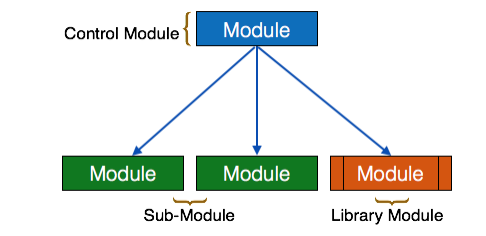
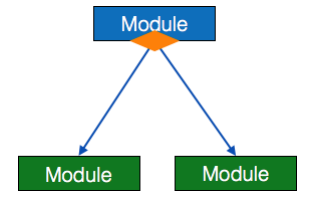
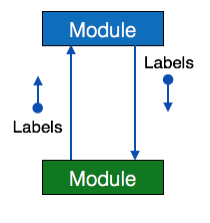
Module:
It stands for a task, subroutine, or procedure. Multiple sub-modules can be branched out of a control module.
Modules from libraries can be reused and are untouchable from any module.

Condition:
It is symbolized by the little diamond at the module’s base. It illustrates how the control module can choose any subroutine in response to a given situation.

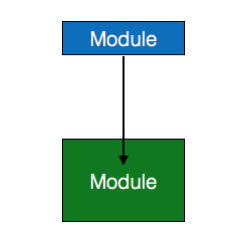
Jump:
To indicate that the control will jump in the middle of the submodule, an arrow pointing inside the module is displayed.

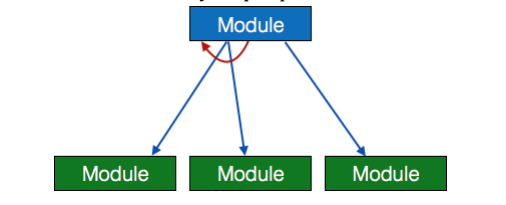
Loop:
In the module, a loop is represented by a curved arrow. Every submodule that the loop covers repeats the module’s execution.

Data flow:
Data flow is shown as a directed arrow with an empty circle at the end.
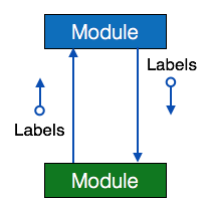

Control flow:
Control flow is shown by a directed arrow that ends in a filled circle.

HIPO Diagram:
The Hierarchical Input Process Output (HIPO) diagram combines two structured approaches for system analysis and documentation. IBM established the HIPO concept in 1970.
The software system’s module hierarchy is shown by the HIPO diagram. An analyst can see a high-level overview of system functions by using the HIPO diagram. It breaks down functions into smaller, more manageable functions in a tiered fashion. It shows the roles that the system plays.
HIPO diagrams work well in the documentation. Designers and managers can more easily understand the system structure through their graphical representation.

HIPO does not offer any information regarding data flow or control flow, in contrast to an IPO (Input Process Output) diagram, which shows the flow of control and data in a module.
As an Example:
Software program structure design and documentation use both the Hierarchical Presentation and IPO Chart portions of the HIPO diagram.
Structured English:
Because most programmers don’t understand software as a whole, they merely follow instructions from their bosses. Higher software management is in charge of giving programmers precise information so they may write accurate code quickly. Other methods employ graphs or diagrams, and different people may perceive them in different ways.
For this reason, software analysts and designers create technologies like Structured English. It is nothing more than an explanation of what has to be coded and how. Coders are better able to write error-free code when they use structured English. Some people may view other forms of methods—which make use of graphs or diagrams—differently at times.
Structured English refers to the structured programming paradigm that makes use of the everyday English language. It is a form of explanation of what needs to be coded and how to code it, not the final code. A few symbols from structured programming are as follows.
- IF-THEN-ELSE
- DO-WHILE-UNTIL
Because the analyst uses the same variable and data name—both of which are kept in the Data Dictionary—writing and comprehending the code is considerably easier.
Example:
We use customer authentication in the context of online buying as an example. Structured English can be used to express this client authentication process as follows:
Enter Customer_Name
SEEK Customer_Name in Customer_Name_DB file
IF Customer_Name found THEN
Call procedure USER_PASSWORD_AUTHENTICATE()
ELSE
PRINT error message
Call procedure NEW_CUSTOMER_REQUEST()
ENDIF
Written in structured English, the code is similar to spoken English in daily speech. It is not immediately implementable as a software code. Programming language is not relevant to structured English usage.
Pseudo Code:
Writing pseudo code is similar to writing programming language. It may be compared to a programming language that has been enhanced with comments and descriptions. Variable declaration is avoided in pseudo code, but it is nevertheless created using constructs from real programming languages like C, Fortran, Pascal, and so on.
More programming information is present in pseudo code than in structured English. It offers a way to carry out the operation, simulating computer code execution.
Example: Program to print Fibonacci up to n numbers.
void function Fibonacci
Get value of n;
Set value of a to 1;
Set value of b to 1;
Initialize I to 0
for (i=0; i< n; i++)
{
if a greater than b
{
Increase b by a;
Print b;
}
else if b greater than a
{
increase a by b;
print a;
}
}
Decision Tables:
A decision table is a structured tabular representation of situations and the corresponding actions that need to be taken to address them.
It is an effective tool for error prevention and debugging. It facilitates the consolidation of related data into a single table, and the combination of tables allows for simple and convenient decision-making.
Making a Table of Decisions:
The developer needs to take these four simple actions to generate the decision table:
- Determine all conditions that need to be addressed and decide on appropriate measures for each one that has been found.
- Create as many rules as you can.
- Describe the action for every rule.
End users should validate decision tables, and they can now be made simpler by removing unnecessary rules and activities.
Let’s look at a basic example of a regular issue we have with our Internet access. We start by listing every issue that could occur when launching the internet along with any potential fixes.
Under the conditions column, we list every potential issue, and under the actions column, we provide the various solutions.


Entity-Relationship Model:
A kind of database model called an entity-relationship model is predicated on the idea of actual entities and the relationships that exist between them. Real-world scenarios can be mapped onto the ER database model. The ER Model generates a collection of entities together with their characteristics, restrictions, and relationships between them.
The optimal application of the ER Model is in conceptual database design. The following is a representation of the ER Model:
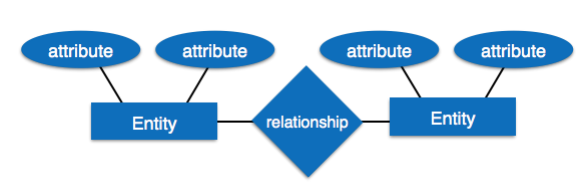

- Entity: A real-world entity with certain qualities is referred to as an entity in the ER Model. Each attribute has a domain, or matching set of values, that define it.
Consider a school database, for instance. In this case, a student is an object. The attributes of a student include name, ID, age, class, and so on. - Relationship: A relationship is a logical correlation between entities. Different mappings are used to associate relationships with entities. The amount of associations between two things is defined by mapping cardinalities.
Data Dictionary:
The central repository for data-related information is called a data dictionary. It saves information about the origin, meaning, and relationship of the data as well as the format and utilization of the data. All terms in the data dictionary have precise descriptions to help software developers and users.
Meta-data, or data about data, is a term frequently used to refer to data dictionaries. It is made in tandem with the software program’s DFD (Data Flow Diagram) model and is supposed to be updated whenever DFD is modified.
Thanks a lot for sharing this with all people you really
realize what you are talking approximately!
Bookmarked. Kindly additionally talk over with my website =).
We could have a hyperlink exchange contract among us
What’s up to all, it’s genuinely a pleasant for me to visit this web page, it contains useful Information.
This post is truly a good one it helps new the web users, who are wishing for blogging.
Your style is so unique compared to other folks I
have read stuff from. Thank you for posting when you’ve got
the opportunity, Guess I will just book mark this page.
Every weekend i used to visit this web page, because i want enjoyment, as this this site
conations truly nice funny stuff too.
This article is truly a fastidious one it assists new
web users, who are wishing for blogging.
Hello there! This blog post couldn’t be written any better!
Looking at this article reminds me of my previous roommate!
He always kept talking about this. I will send this article to him.
Fairly certain he’ll have a great read. Thanks for
sharing!
Hi there, You have done an incredible job. I will definitely digg it and personally recommend to my friends.
I am sure they’ll be benefited from this website.